Exploring the Provided Example Trainingset
Let's start by playing around with our provided example so you can familiarize with our software and get a better feel for the task and the workflow.
The example data we're working with in this tutorial are recordings of one of our monkeys performing a simple grasping task in our 12 camera setup. Your task is to track his hand while he is enjoying a variety of fruits we hand him.
We will split the task into four steps:
- Installing our Pytorch Toolbox and downloading the example recordings.
- Visualizing the provided annotations, both in 2D and 3D.
- Training the entire network stack.
- Predicting Poses for the Example Recording.
- Creating Annotated Videos from Your Predictions.
1. Installing the Toolbox and Downloading the Data
First let's take care of setting up the software. Make sure you have a version of Anaconda installed. If you want to train networks also make sure that your PC has a Nvidia GPU with working CUDA drivers installed.
There are only a few simple steps you need to take to install the toolbox:
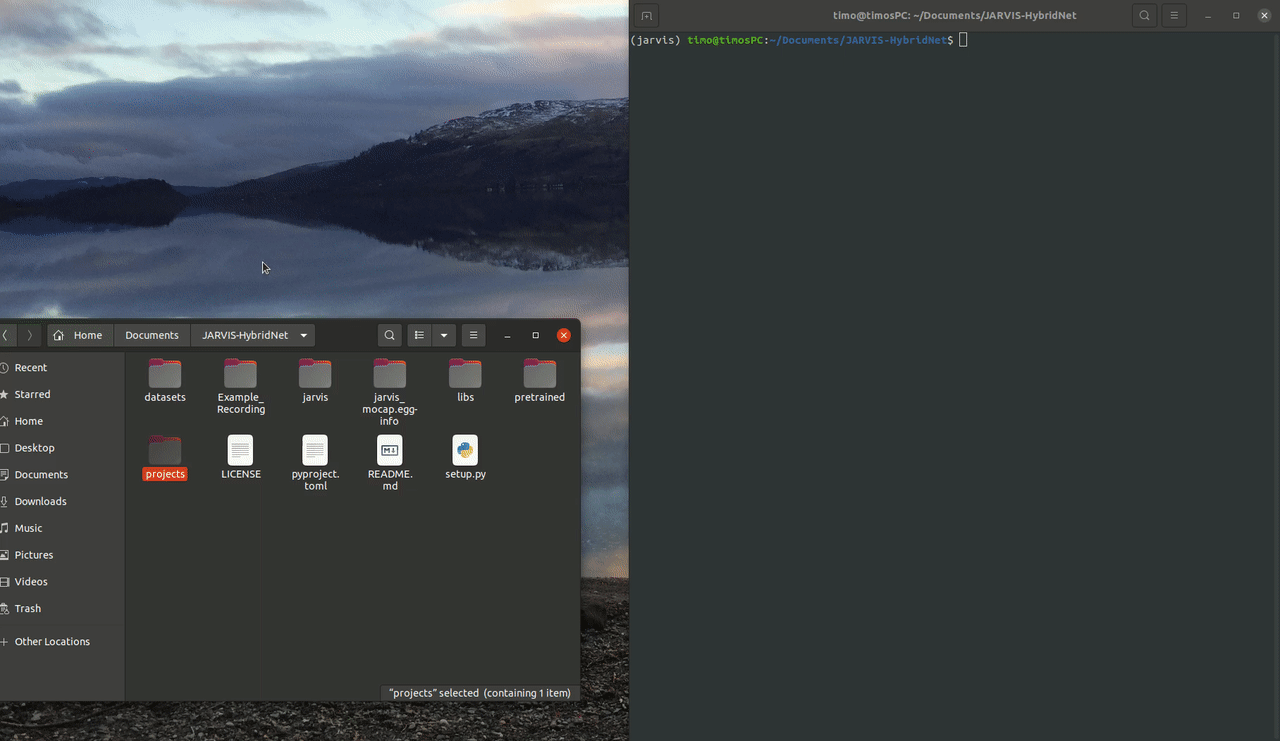
- Download the python package. To do this open up a terminal and run:
-
Create the
jarvisAnaconda environment by running: -
Activate the environment (you will need to do this every time you open a terminal to use JARVIS):
-
Install the required version of the setuptools package:
-
Install JARVIS:
With that out of the way the only thing left to do is downloading the example recordings by clicking here.
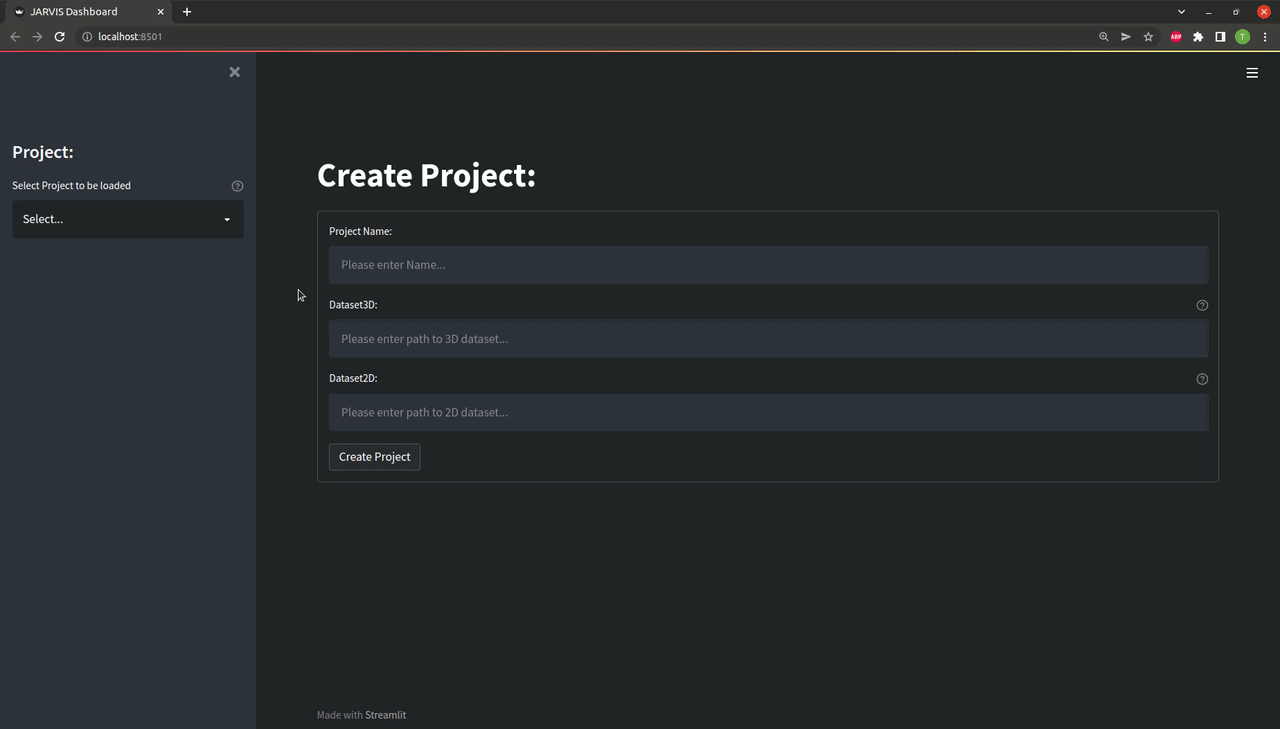
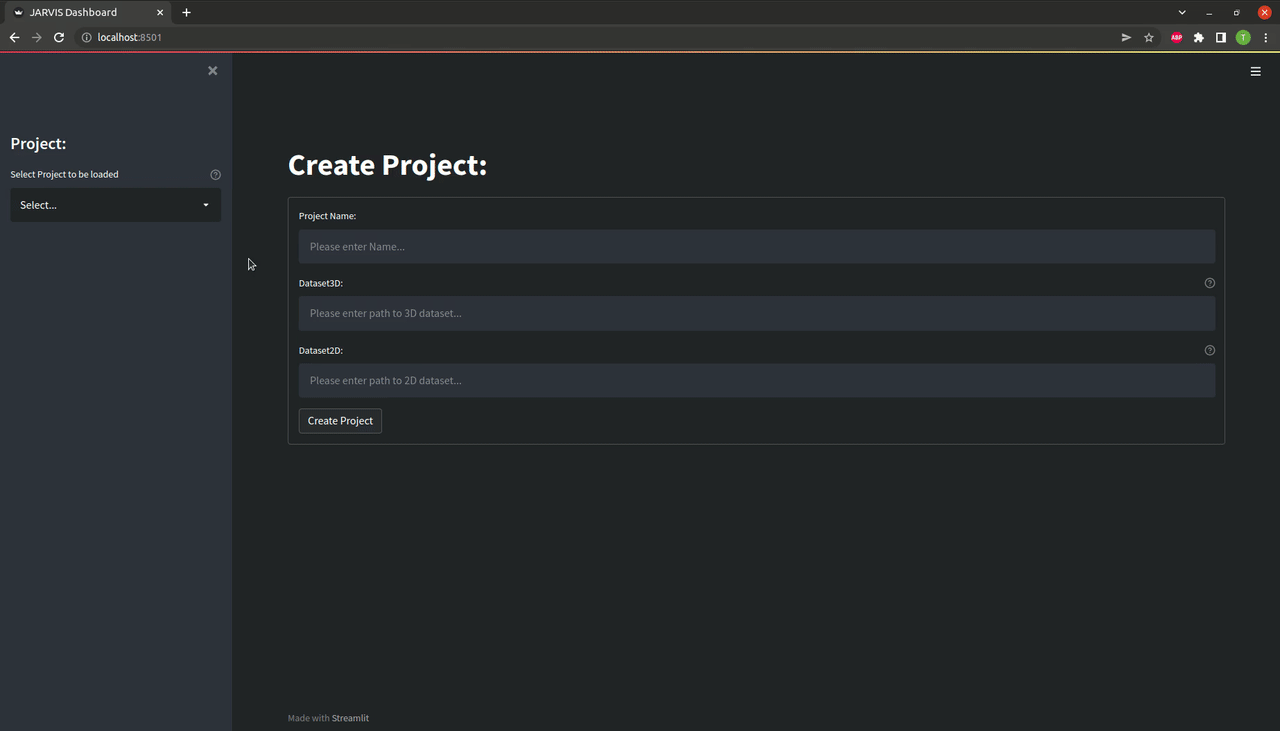
 Congratulations, you are all set up now! To launch our handy streamlit GUI interface just open a terminal, activate the conda environment by running
 conda activate jarvis and type jarvis launch.
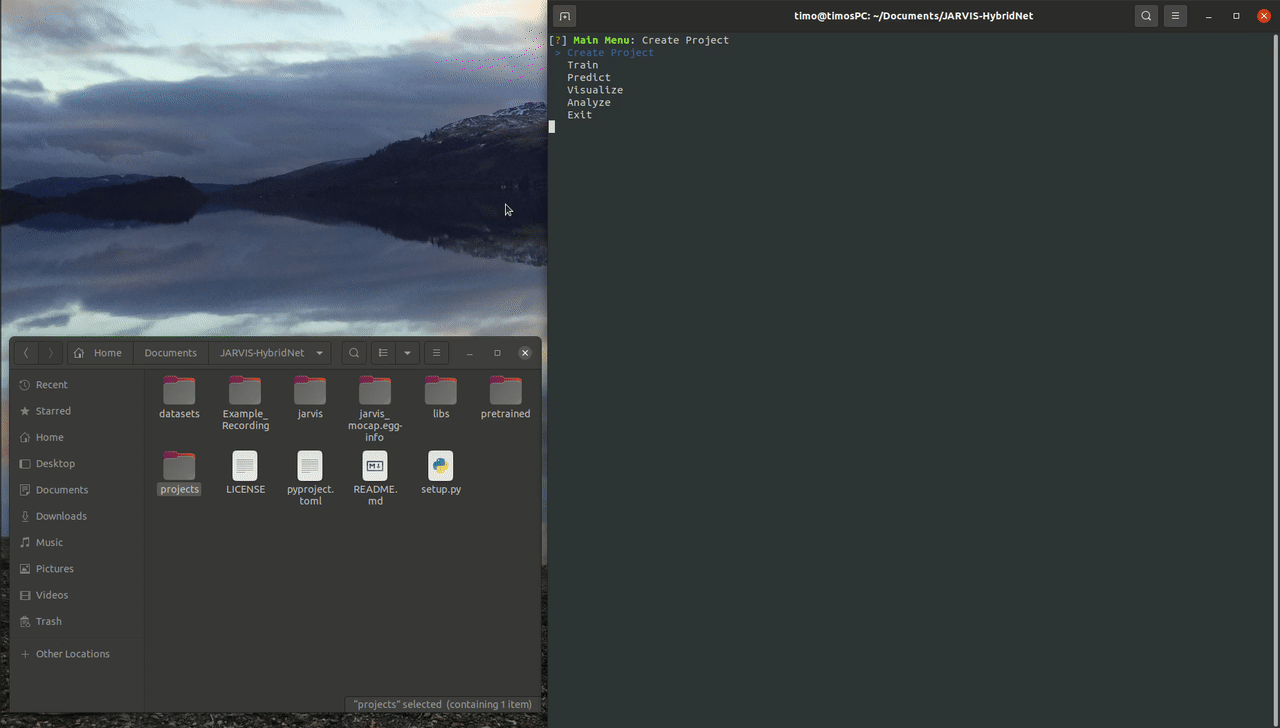
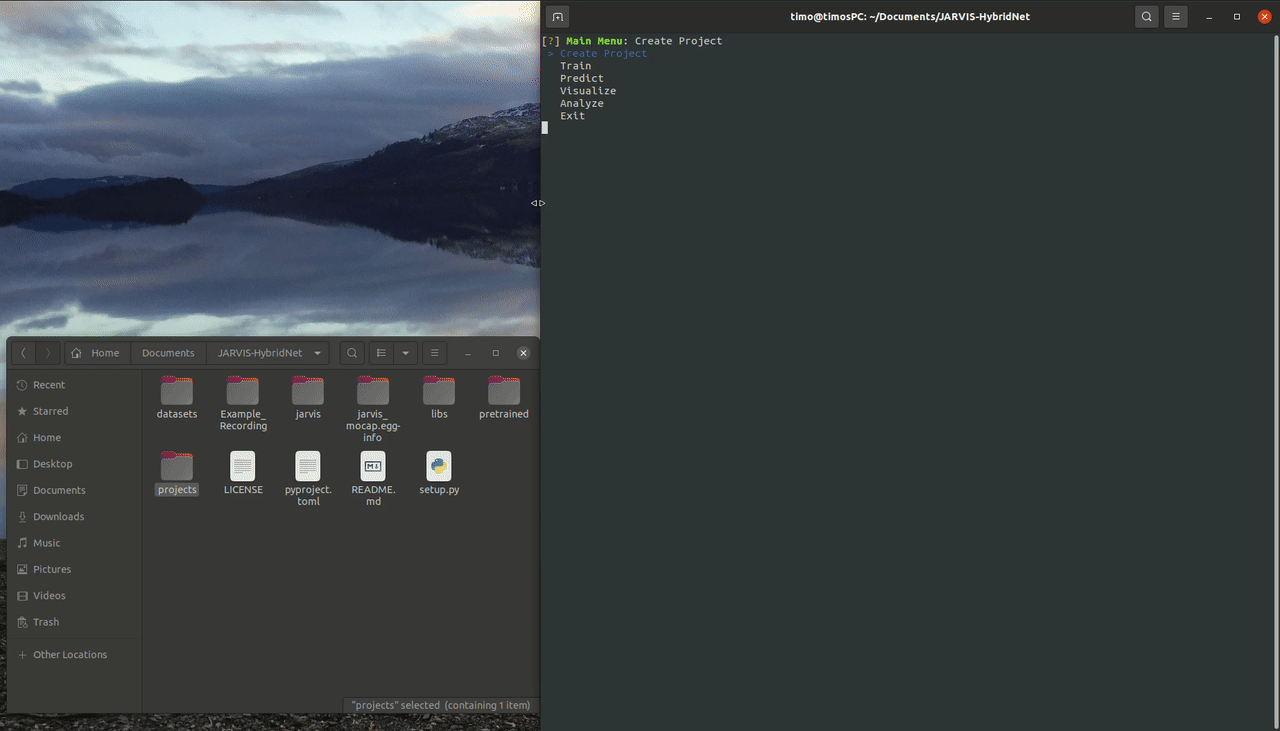
Alternatively you can also interact with jarvis through the command line. To do this activate the conda environment and then run jarvis launch-cli. The following sections give you the option to switch between instructions for both methods by selecting the respective tabs.
2. Visualizing the Example Trainingset
Before we dive into training JARVIS to track anything it is always a good idea to have a look at the trainingset your are using, both in 2D and in 3D.
To do this using the streamlit dashboard first launch the JARVIS streamlit dashboard as described above by running jarvis launch. Once the GUI pops up in your browser you can select the Example_Project from the drop-down menu and then navigate to the visualization menu.
As you can see there are a bunch of option for visualizing both your predictions and your trainingset. You can see how that looks like above, but feel free to play around with it a bit to familiarize yourself with the data you are working with.
To do this using the command line interface first launch it by running 'jarvis launch-cli'. You will see a menu appear in your terminal that you can navigate using your arrow keys. To visualize your dataset select the Visualize menu and then pick either the Dataset2D or the Dataset2D option.
To visualize the example trainingset select the 'Example_Project' and the 'Hand' skeleton preset. Other than that feel free to play around with the different options.You can cycle through all the available frames by pressing any key. Pressing 'q' or 'esc' will take you back to the Visualize menu.
Once you start working with your own data, checking your trainingset before training is really important to ensure there was no problem when creating it and your network will get the input you expect it to get.
3. Training the Entire Network
Now that you know what our data looks like it is time to train the network stack.
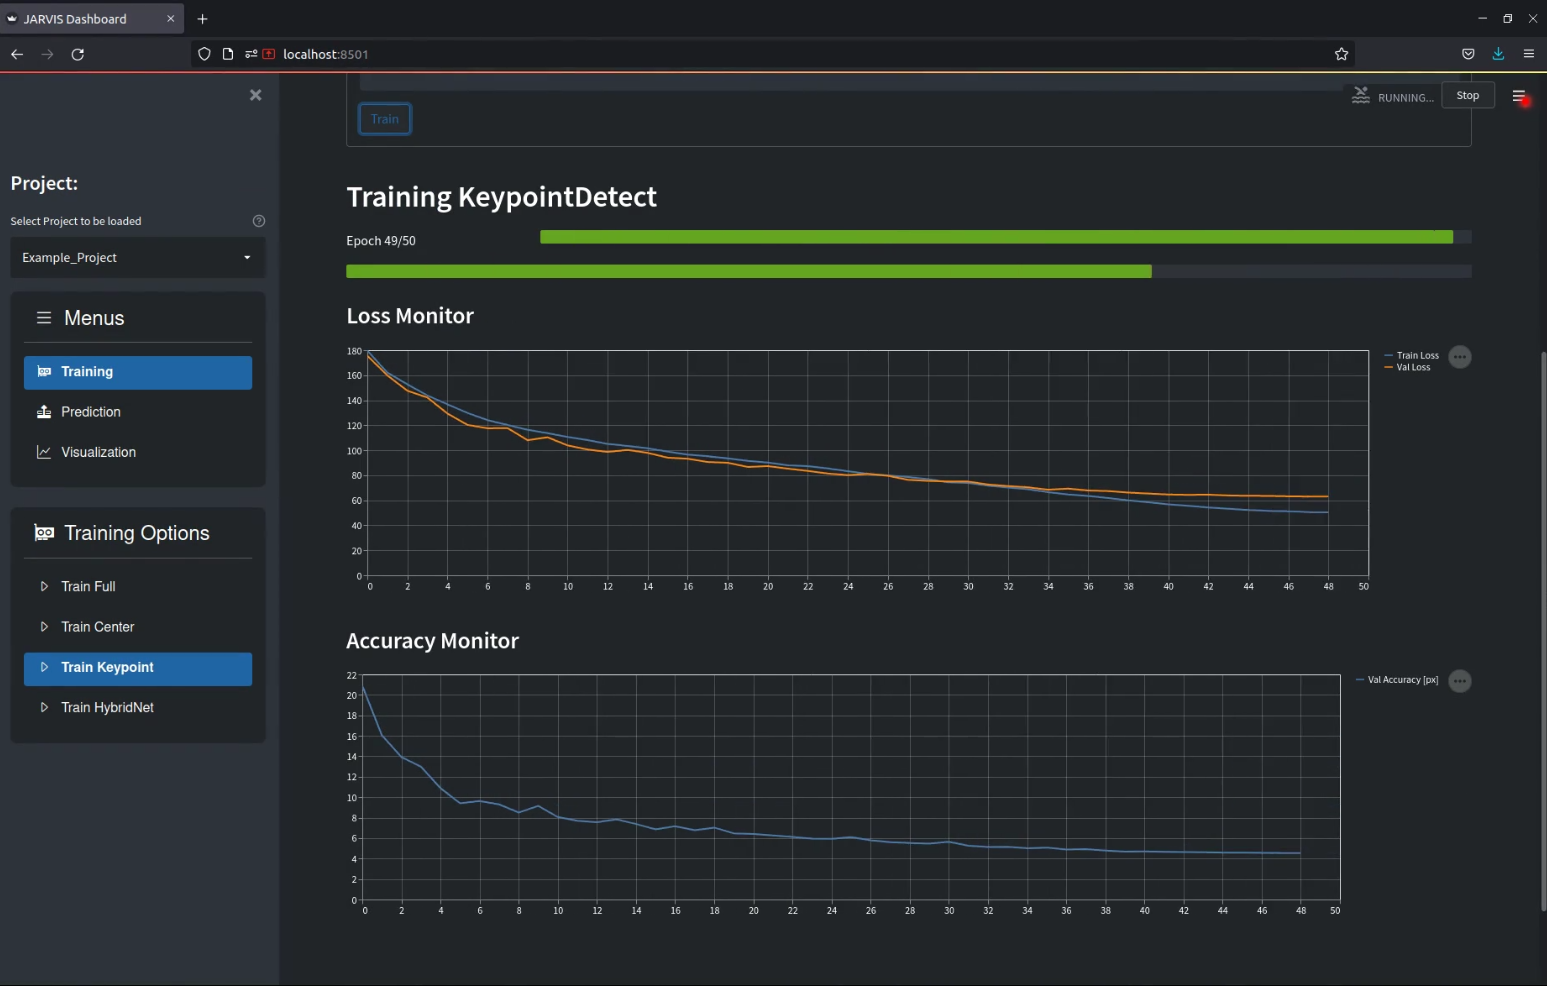
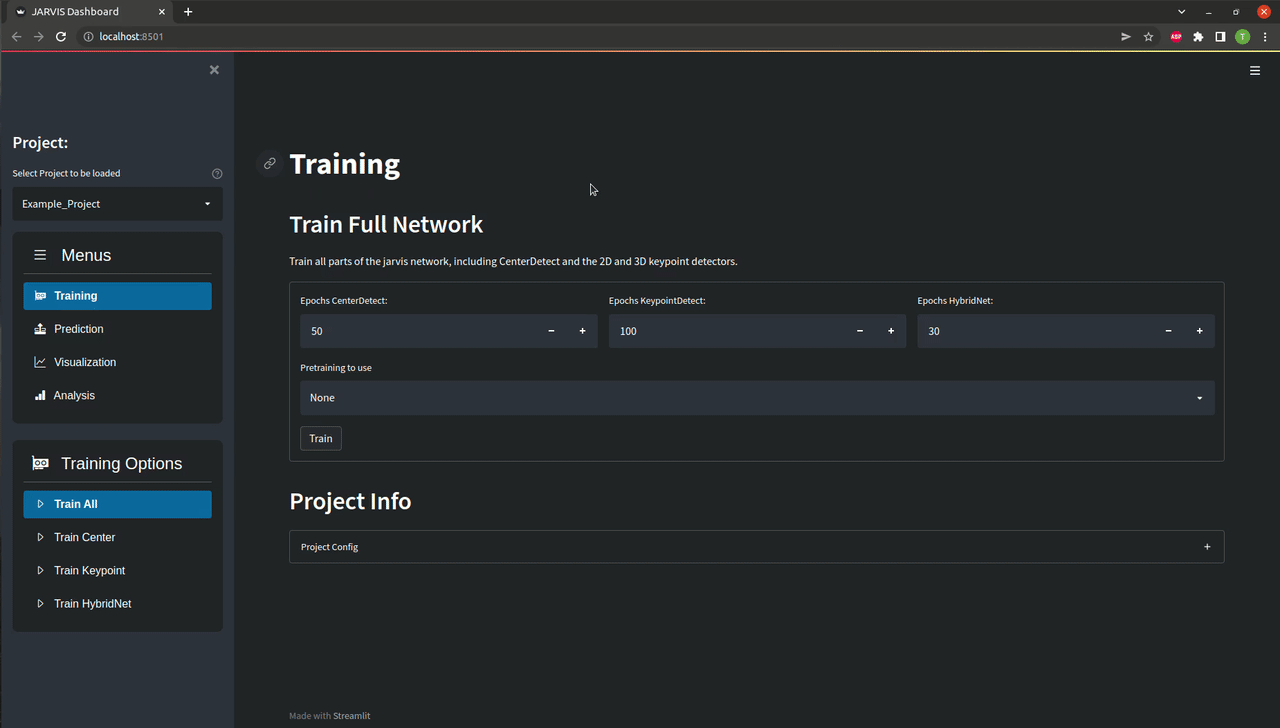
Using our GUI this is really easy, all you need to do is to navigate to the Train Full menu and press train as shown below. If everything works correctly you should see two progress bars as well as a plot showing the training progress appear. Depending on your GPU training might take up to a few hours, so a bit of patience is required at this point. If you don't want to wait you can also continue with our pretrained weights of course.
The CLI makes this very easy. All you need to do is launch the interface by running jarvis launch-cli, select the Train menu and then run Train all as shown below. If everything works correctly you should see a progress bar appearing. Depending on your GPU training might take up to a few hours, so a bit of patience is required at this point. If you don't want to wait you can also continue with our pretrained weights of course.
More Info on Network Training
Our network stack is trained in four steps:
- Training CenterDetect: In this step a 2D-CNN is trained to detect the center of the entity you are tracking. This will be used to estimate the location of the entity in 3D, essentially telling the 3D-CNN where to look.
- Training KeypointDetect: In this step another 2D-CNN is trained to detect all your annotated keypoints in a single image. The output of this network will subsequently be used to construct the 3D feature volume that is the input of our 3D-CNN.
- Training HybridNet: In this step the 3D part of our full HybridNet architecture is trained. It's job is to use the 3D feature volumes created by the KeypointDetect stage to create the final 3D pose predictions.
4. Predicting Poses for the Example Recording
If you haven't already you should now download our example recording.
Once you have the example recording saved on your computer all you need to do is launch the JARVIS GUI and navigate to the Predict3D menu as shown below. Here you will have to specify a couple of things:
- Path of recording directory is the path of the example recording you just downloaded, it should include the 'Example_Recording' directory.
- Weights for CenterDetect / HybridNet lets you specify which weights you want to use. If you have trained models yourself you can leave them at 'latest'. If you didn't train the network yourself you will have to put the path of the pretrained weights here. They can be found in the 'pretrained' directory inside your 'JARVIS-Hybridnet' folder.
- Start Frame & Number Frames let you select on which part of the recording you want to run the prediction. For quick results set 'Number of Frames' to 1000. To predict until the end of the recording set it to -1.
Once all those settings are correct, press the Predict button and wait for the progress bar to fill up as shown below.
Once you have the example recording saved on your computer all you need to do is launch the JARVIS CLI and select Predict3D in the Predict menu as shown below. Here you will have to specify a couple of things:
- The Recordings Path is the path of the example recording you just downloaded, it should include the 'Example_Recording' directory.
- Select No for using TensorRT acceleration for now. If you installed the optional TensorRT packages this lets speed up predictions using NVIDIAs TensorRT library. Compiling the TRT models takes quite some time though.
- If you have trained models yourself you can use the most recently saved weights. Otherwise you will have to specify the path of the pretrained weights for the CenterDetect and the HybridNet networks here. They can be found in the 'pretrained' directory inside your 'JARVIS-Hybridnet' folder.
- Select No when asked if you want to use a calibration that is not in the trainingset.
- To quickly get some results also select No when asked wether you want to predict for the whole video
- Start Frame & Number of Frames let you select on which part of the recording you want to run the prediction. For quick results set 'Number of Frames' to 1000, to predict until the end of the recording set it to -1.
After answering all the prompts you should see a progress bar filling up as shown below.
Once the process is finished you will find a directory with a current timestamp in the projects folder under predictions. That folder contains a 'data3D.csv' file that contains the 3D coordinates and their corresponding confidences for every point in time. The directory also contains a '.yaml' file that holds some information necessary for creating videos from your predictions.
5. Creating Annotated Videos from Your Predictions
The easiest way to check the quality of the predictions you just created is looking at annotated videos. For the 3D predictions those videos are created by projecting the 3D coordinates of the keypoints back into all available camera perspectives.
In the GUI navigate to the Visualization menu as shown below. Here the right prediction directory should already be selected. If you want you can remove or add cameras from the list of cameras for which you want to create annotated videos. You can now click Create Video as shown below. If everything is set correctly you should find a directory containing your freshly labeled videos in the project directory after the progress bar is filled up.
Navigate to the Visualize Menu after launching the JARVIS CLI. After selecting Create Videos 3D and the Example_Project you should be able to select the Predictions_3D directory that you created in the last step. If you want you can now select and deselect all the cameras that will be used to create your annotated videos. If everything is set correctly you should find a directory containing your freshly labeled videos in the project directory after the progress bar is filled up.